How We Redesigned a Highly Scaled Data Store to Lower 99th Percentile Latency 100x
Product & Tech
Roblox hosts millions of concurrent games, tracking their stats in the Roblox Game Instances Service. We’ll explore the architecture of the Games Instances Services and explain how we managed to improve it via a new sharding design. We’ll also explore the benefits of the new design (including the lower latency).
How does Roblox Game Instances Service work?
Roblox Game Instances Service (GIS) is responsible for keeping up-to-date information on the live Roblox play sessions, for these main purposes:
- Assisting Roblox Game Servers with play session launches, closes and place-to-place teleports
- Providing real-time play session information to Roblox Platform Services
- Streaming play session data to Roblox Data Warehouse
GIS is called by thousands of Game Servers distributed worldwide across the Roblox data centers, as well as by Roblox Platform Services, as shown in the following chart.
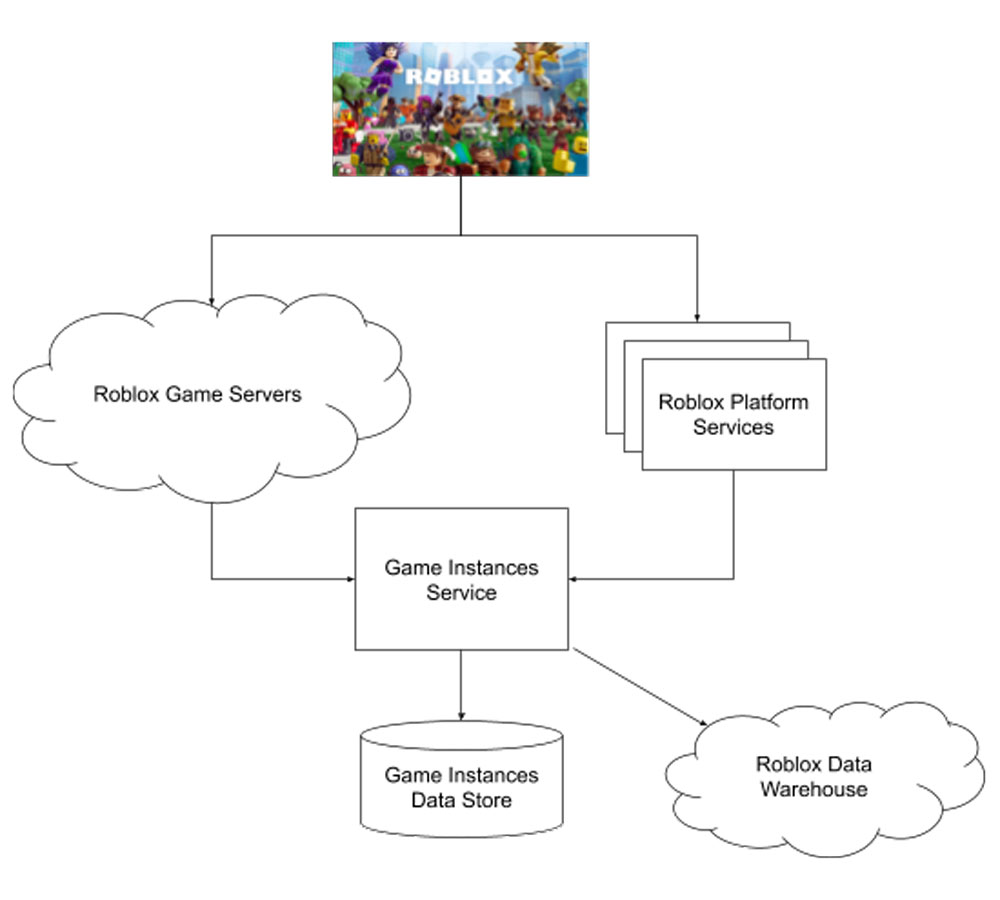
GIS receives events and updates during the Roblox gameplay lifecycle: during game creation, every 30 seconds of gameplay, and when a game closes. Roblox Game Servers not only supply updates, but also depend on GIS to provide up-to-date player and game instance information to coordinate among the disparate game instances. Players are able to join new games as well as teleport among game places based on the data supplied by GIS.
GIS, in its turn, depends on the Game Instances Data Store (GIDS). GIDS is a custom built store operating with sub-millisecond latency. GIDS is highly scaled, serving tens of millions of requests per minute at peak. GIS, in addition to returning responses to the Roblox Game Servers and Platform Services, also emits play session message streams to the Roblox data warehouse as well as some of the real time services such as Roblox Search.
Scaling Challenges
GIDS experienced major scaling challenges due to the hot shard issues. Initially, GIDS sharded game instances data based on the game title-related identifiers: universe and place IDs (there is one universe ID and could be multiple place IDs per game title). This sharding scheme was closely related to the main data indexes inside GIDS, allowing fast access to the universe and place related data.
Such sharding scheme based on universe and place IDs led to the issues like shown in the following chart:
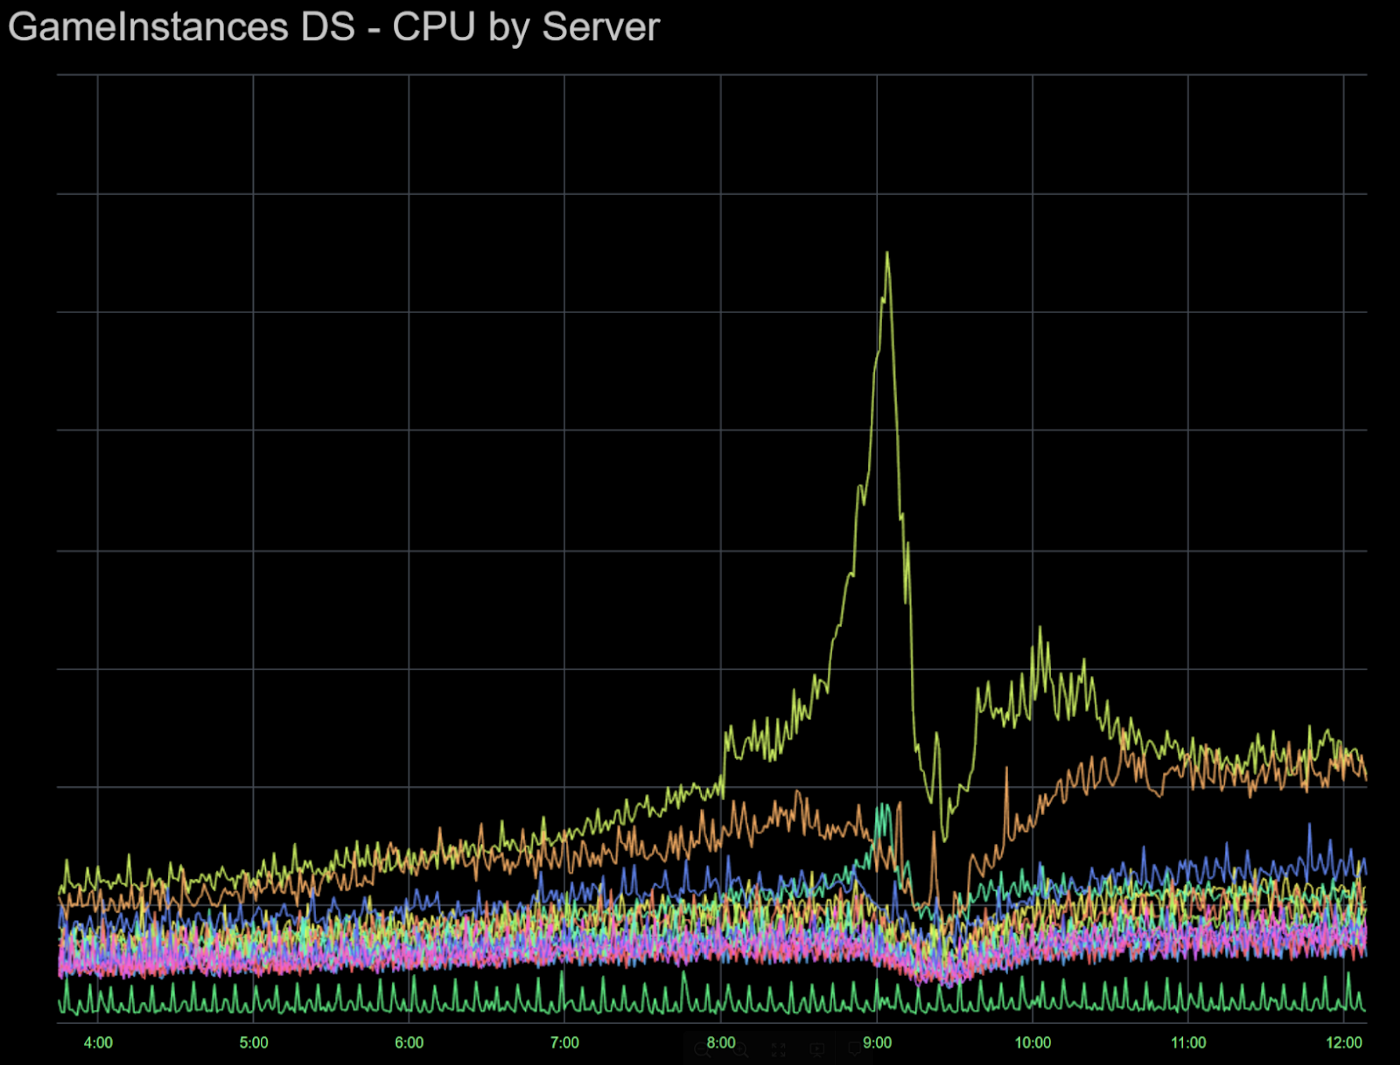
One or more of the GIDS shards could get a much higher CPU load (e.g. during a popular game launch), while the remaining GIDS servers stayed relatively unused. We could easily hit a 100% CPU utilization on a GIDS server, leading to game and/or application outage events. GIS and GIDS remained one of the central Roblox operations discussion topics, especially during popular game launches.
GIDS New Sharding Scheme
We designed a new sharding scheme for GIDS, implemented via a dedicated library, following this architecture:

In this scheme,
- “Write” is a create, update, or delete request for a specific data key.
- “ID Specific Read” is a read request that queries only one data key.
- “Aggregated Read” is a read request across multiple data keys.
Even though GIDS is highly available, we still wanted to make sure that individual node replicas remained mutually consistent. To achieve this, write requests from GIS to GIDS could be retried in case of individual write failures. Data replication across many GIDS nodes actually provides a higher degree of availability since individual read failures could be compensated by the parallel replica reads.
Successful Scaling
Once we moved to the new sharding scheme, GIS and GIDS operations could be described by the word “boring”:
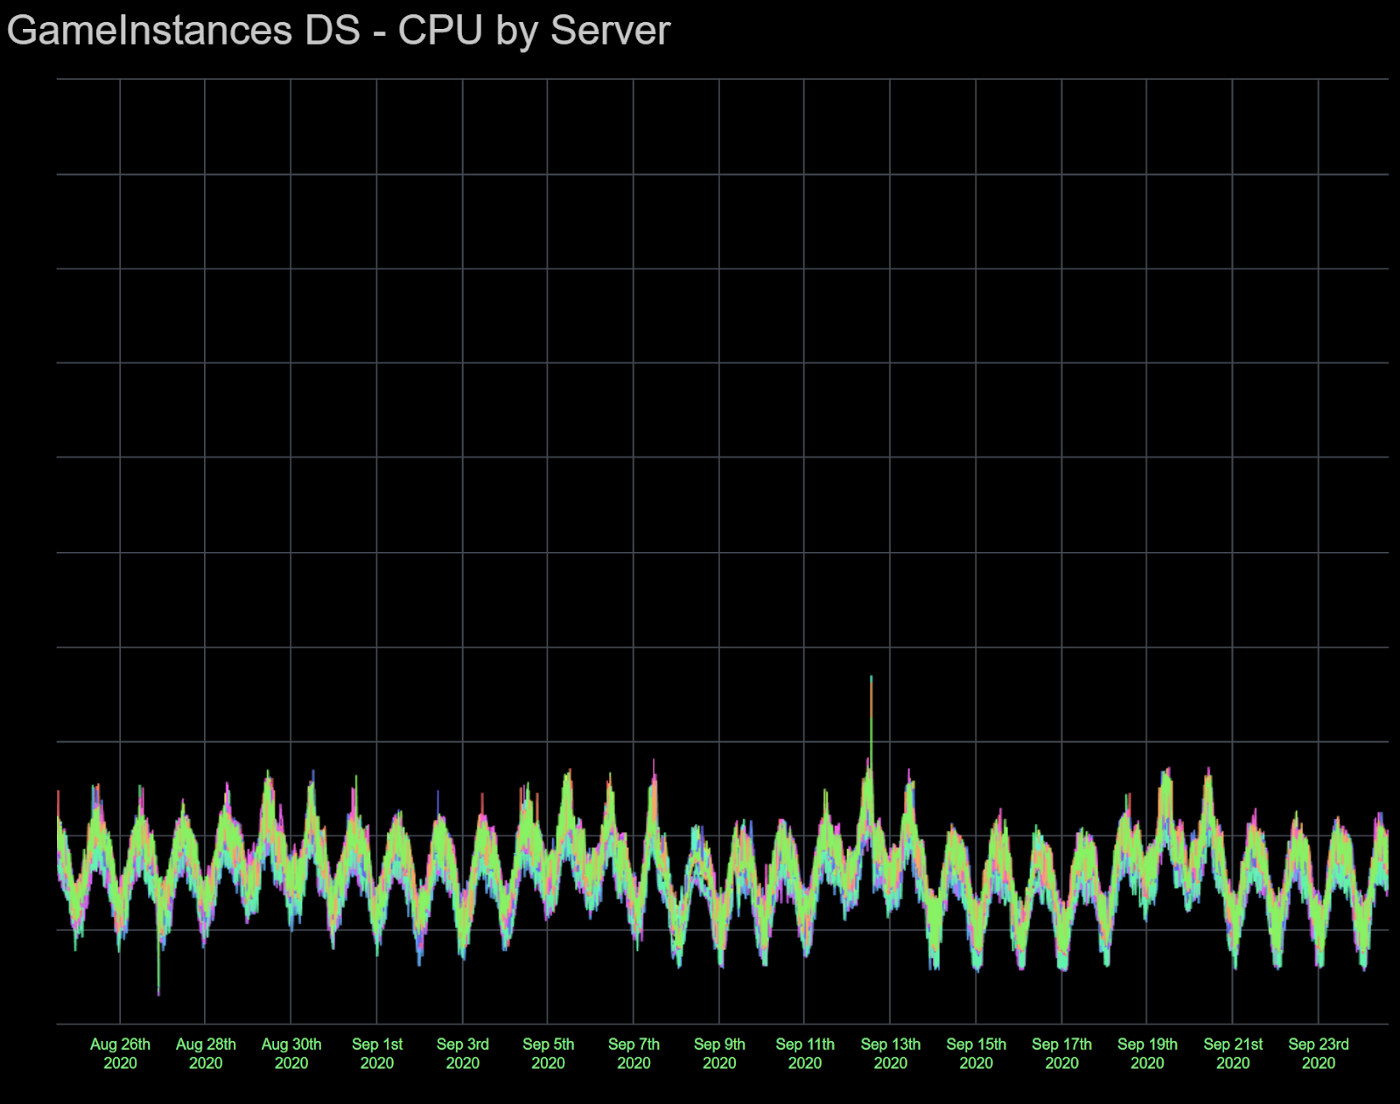
Most dramatic Roblox game launches, with millions of incoming new players joining within a few minutes, have become virtually invisible on GIDS CPU utilization charts whereas previously, hot shards were a constant threat to the Roblox platform stability.
What is 99th percentile latency?
Definition
People who deal with highly available services have heard of this term probably more than once, as this measure could be even more important than average latency. If we measure response time of some service endpoint, “99th percentile latency” means that 99% of the requests should be faster than this measure.
Is it important?
High 99th-percentile latency is a non-starter for a critical and highly called backend service. As mentioned in this blog, it is often the case that a central backend service is called at least 10 times during the user’s interaction with the system, causing the 99th percentile latency to affect almost 10% of users. If this latency is high, this could mean highly visible negative user experience, or even a buggy system.
But why should my 99th percentile latency be high?
As mentioned in the same blog, high 99th percentile — p99 — latency could be a common occurrence that is extremely hard to troubleshoot. It’s “business as usual” that services have to deal with very short and very long requests simultaneously. In these cases, long requests could interfere with short requests, e.g., on the shared network interface controller level, creating high p99 latency. This has been the case for the Game Instances Service, or, GIS, a highly critical Roblox service responsible for tracking statuses of millions of concurrent Roblox play sessions.
Is there a simple solution to reduce 99th percentile latency?
Yes!
Fortunately, the “Hedging your bet” solution is well known. We send two parallel identical requests to the same distributed service, waiting for the fastest response. The new p99 latency in this case will be equal to the original average latency: on the average, every original p99 response from one of the requests will be combined with an average response from the other request. We could then discard the slower request, producing the new, much lower p99 latency.
Great. But simple?
However, most engineers probably would not consider this solution simple. Especially if we deal with write requests to a data store. Even read requests could be tricky in case of a data store if e.g. every data key has only one physical server where it is stored. Making two identical requests to the same server seems questionable, likely to produce interference between the two responses.
How do you make it simple?
Sending two parallel requests to a stateless service, or as read requests to a distributed data store API is straightforward. This could be accomplished by any modern programming language in a few lines of code. We mostly use C# at Roblox for backend services, and you could go to this article to see how to do this in C#.
This is less straightforward if the service we call is storing data for the same data keys on the same nodes. As mentioned earlier, calling the same node with the same two requests will likely produce call interference, ruining our combined p99 latency.
Fortunately, we wanted to redesign the sharding scheme for our data store, Game Instances Data Store or GIDS, for the purpose of removing a single point of failure for a single data key. Our original motivation for doing this was to remove “hot shards” that were causing too much stress on some servers in GIDS. No matter how sophisticated our data key per single server scheme was, we could never avoid the hot sharding problem, which was causing many operational issues for GIS and GIDS. The new sharding scheme made it simple to implement the hedging your bet solution both for read and write requests. In fact, this solution was implemented as function calls in the new sharding library. We could now apply the same library not just in GIS endpoints, but other services as well.
Since we used multiple replica nodes per shard, no single data key was stored in a single node, allowing us to easily apply the parallel call example mentioned above to get much better p99 latency. The new sharding library is more complex than a few lines of code, however, I believe it is useful for any data store to have a similar approach to sharding. We will consider the GIDS sharding scheme as an example.
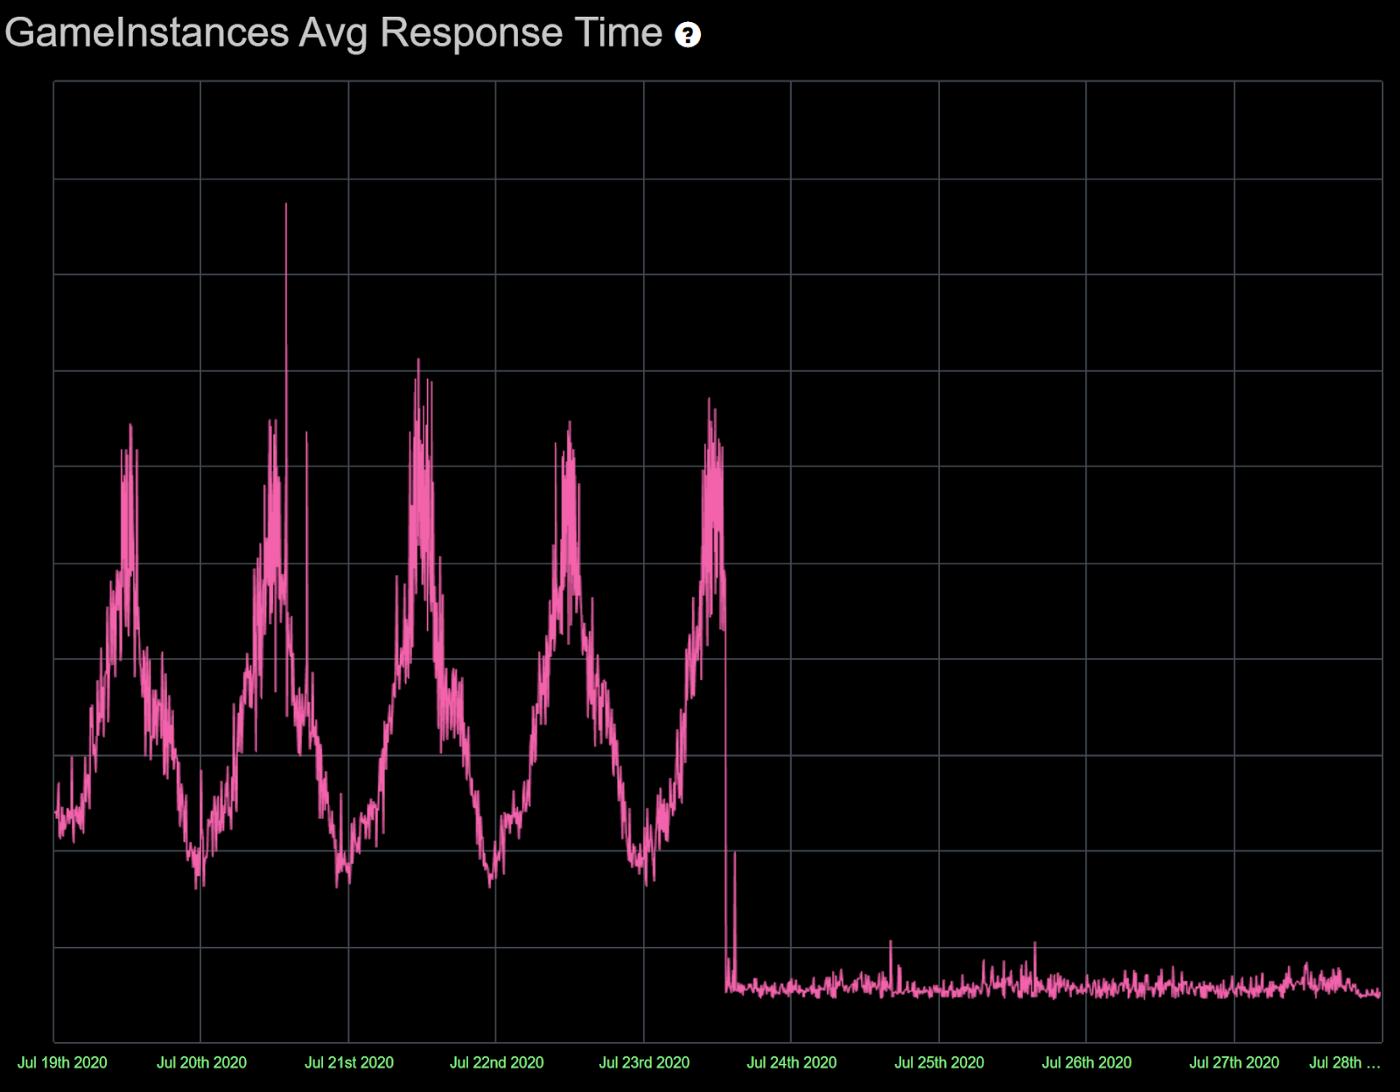
Results
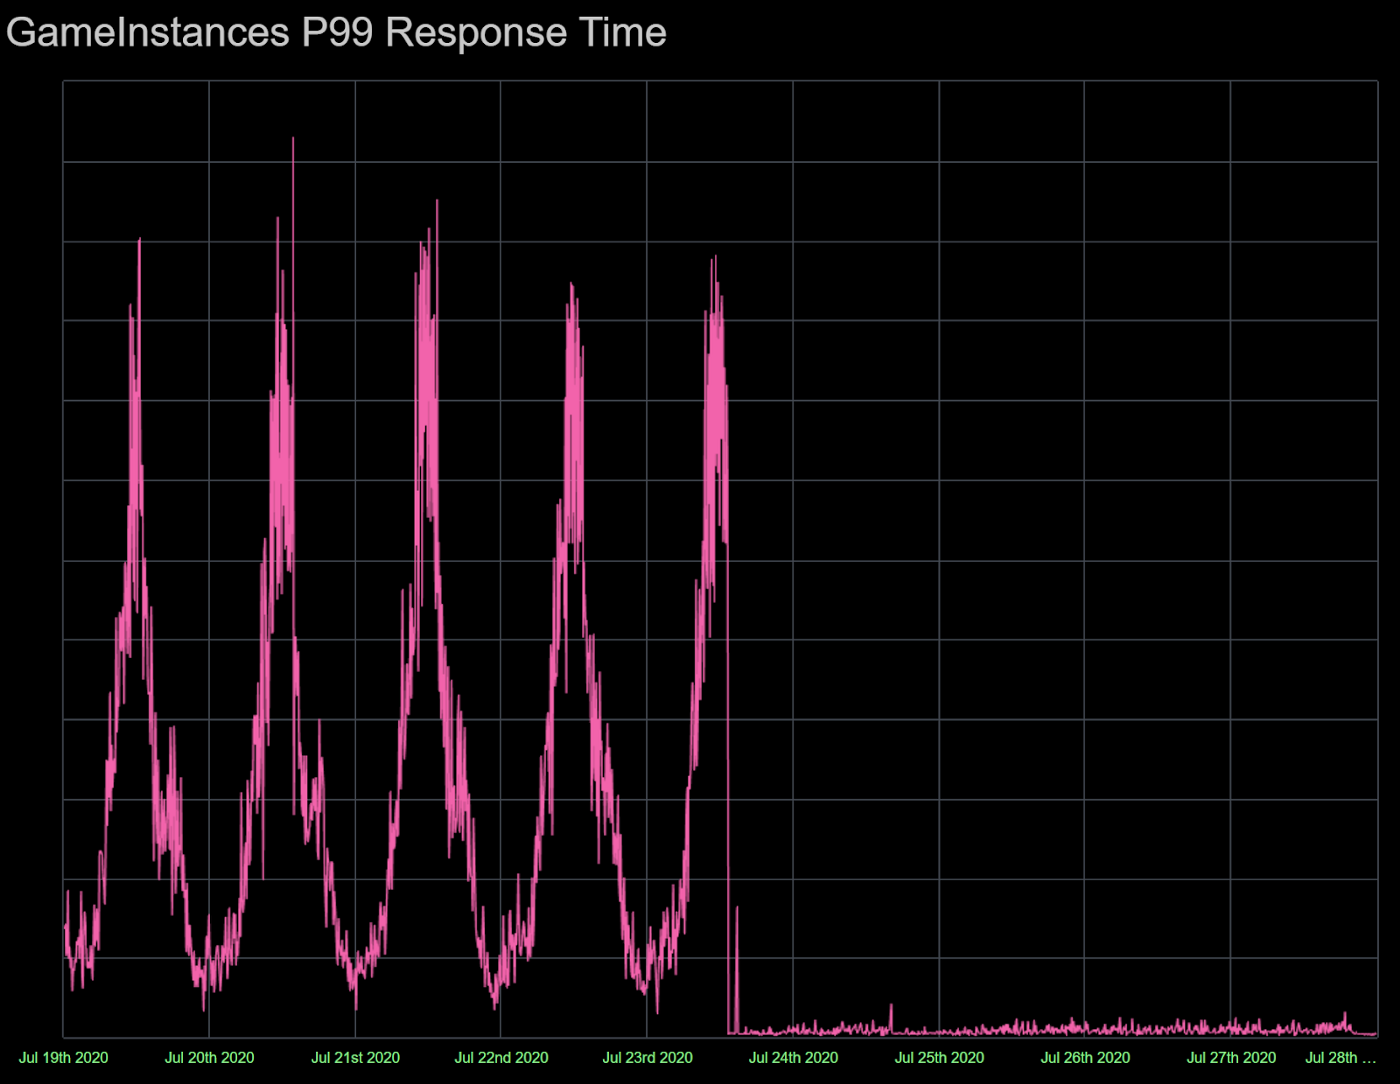
In the case of GIS, the results exceeded our expectations. Not only did GIS p99 latency decrease by more than 100 times, as shown on the graph on the top of this article, our average latency decreased by more than 10 times. This was due to the exponential distribution of latency over the top percentiles of calls, i.e. latency will increase exponentially for any connection if we rank all calls from the shortest to the longest. Even though the median latency was below 1ms for GIS, the average latency was much higher than 1ms because of the very high p99 latency.
You could significantly improve average latency if your original p99 latency is high and then reduced using e.g. the method described above. This article explains why making only two parallel calls gives the highest return on resource investment as opposed to three or more.
Lower p99 latency sounds great, but doubling the call volume?
Many engineers would struggle with the idea that we need to double our calls in order to implement the “hedging your bet” solution. As it turns out, you don’t need to double your calls to greatly improve your p99 latency. We came up with the following solution.
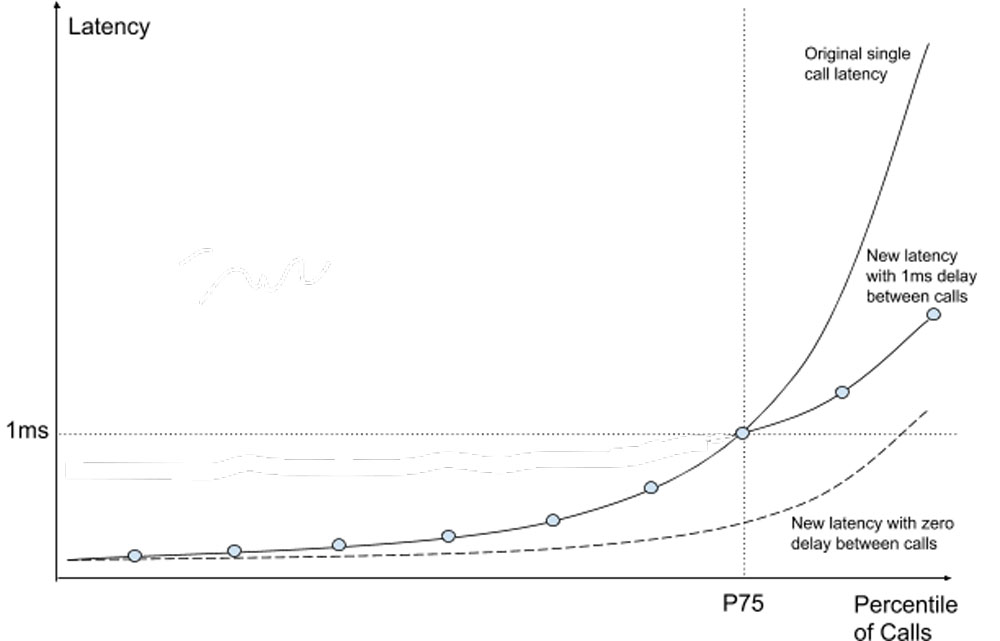
We experimented with the “delayed hedging your bet” solution where you send a second call not at the same moment as the first call, but slightly delayed. In our case, our GIS p75 latency was roughly at 1ms. If we delay the second call by 1ms, there is a 75% chance that we don’t need to send it since we would already get the first call response! I.e., by sending only 25% more calls, we would reduce our maximum average latency from 6 to 7ms down to under 2ms.
Roblox tracks millions of their player games in real time using the Game Instances Service, which relies on the sub-millisecond average responses from the Game Instances Data Store. We successfully scaled these services using the new sharding scheme, removing a dangerous operational point of failure for Roblox. In the process, we reduced the GIS 99th percentile latency for its critical endpoints by more than 100x.
— — —
Andrew Korytko is a Technical Director at Roblox, working with Application Platform and Matchmaking teams. Prior to Roblox, Andrew helped to build massively scaled services at Amazon, Yahoo, and other companies, including Amazon Scheduled Delivery and Yahoo Ad Exchange for Display.
Neither Roblox Corporation nor this blog endorses or supports any company or service. Also, no guarantees or promises are made regarding the accuracy, reliability or completeness of the information contained in this blog.
©2020 Roblox Corporation. Roblox, the Roblox logo and Powering Imagination are among our registered and unregistered trademarks in the U.S. and other countries.