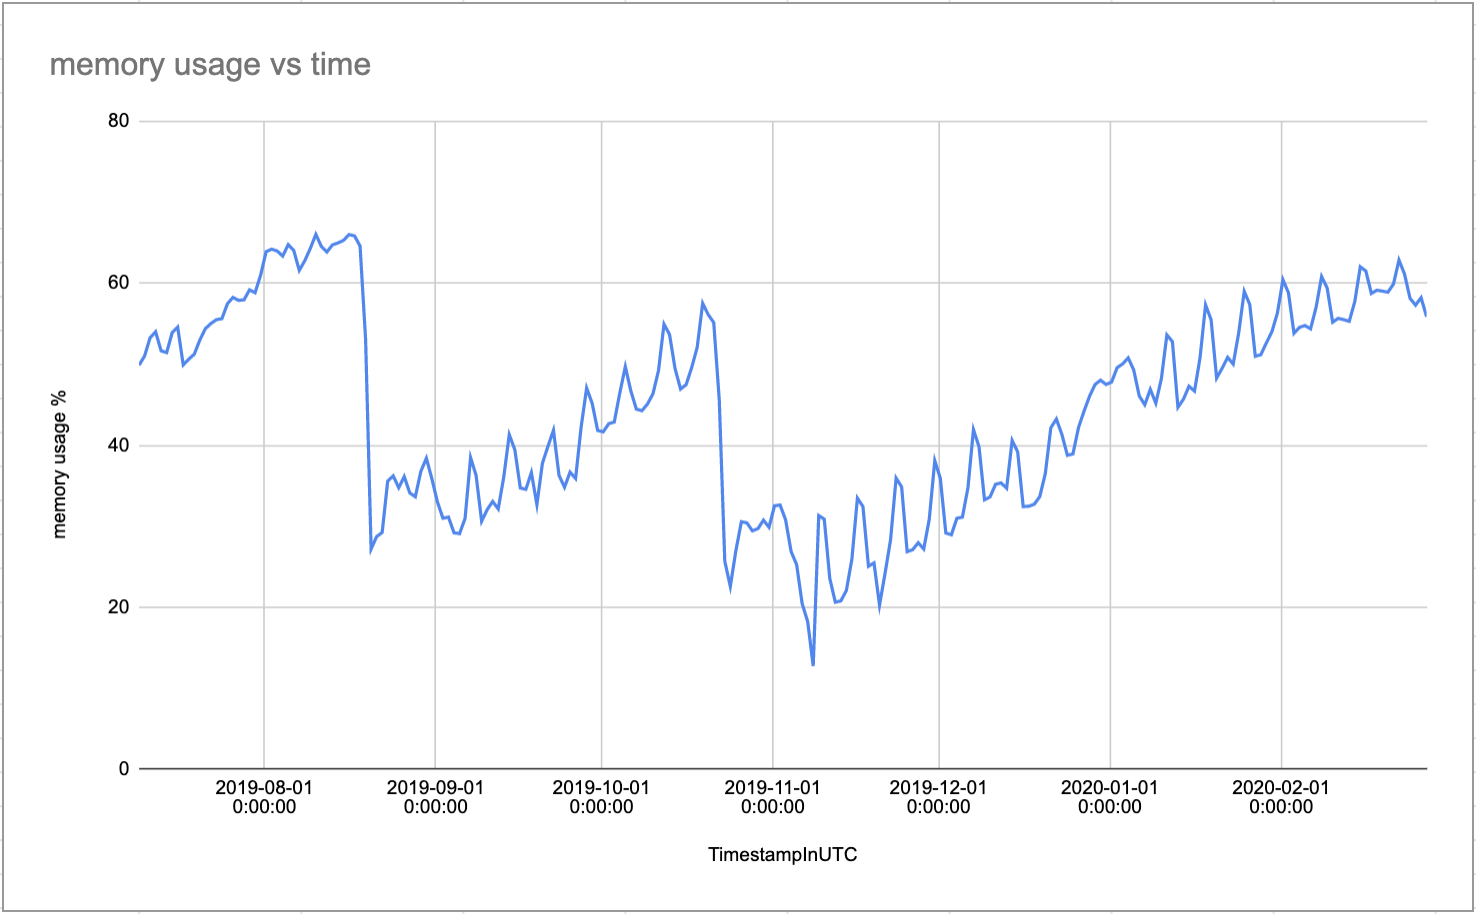
About a year ago we noticed early indications of a pattern emerging showing a decreased capacity in our game servers. At the onset there was little to no player impact because we had plenty of headroom but our buffer was quickly dwindling. A game server will happily accept new players or start new games as long as it has enough cpu and memory resources. In this case it was the memory threshold that was limiting the number of hosted games on a server. Failure to remediate this problem would mean scaling up our data centers to support our player base, which would require a steep labor and financial cost.

The first hypothesis we explored was that the memory usage pattern of games was changing. We encourage devs to push the boundaries of the platform, to use the resources at their disposal to make awesome and ground breaking games. This was easy to check, we could aggregate the memory usage of all games and see if that had risen. But no dice, average memory and percentile aggregates per game stayed relatively flat while our capacity was steadily declining.
We store terabytes of performance and resource usage data per month that can be aggregated and filtered to help find the root cause of issues like this. We tried to isolate the problem to a particular geography, hardware type, software version but unfortunately the issue was present everywhere. We then decided to spot check a few game servers and do some fine grained investigation. I was initially misled by the concept of “free” memory on Linux systems. Which is such a common problem that it prompted someone to register a domain and set up a website to explain the memory categories: https://www.linuxatemyram.com.

TL;DR having most of your memory being used is a good thing, free memory is wasted memory. We only have to worry when the available memory is close to 0.
Once we had determined that we were tracking memory correctly, we got started on a set of experiments to account for where the memory was being used. Our approach was to track specific memory sub categories so we could have a targeted solution.

(note: memory usage % is calculated as (totalPhysicalMemory – availableMemory) / totalPhysicalMemory)
Available memory is calculated as roughly the sum of MemFree + Active(file) + Inactive(file) + SReclaimable.
MemFree tracks unused memory.
Active(file) and Inactive(file) tracks the page cache memory. The page cache stores accessed data in memory to reduce the amount of disk I/O.
SReclaimable tracks reclaimable slab memory. Slab memory is used for keeping caches of initialised objects commonly used by the kernel.
The first experiment was to tweak the cache tuning, specifically: vm.vfs_cache_pressure and vm.dirty_background_ratio.
vfs_cache_pressure increase will make it so we are more likely to reclaim objects from reclaimable cache. This has a performance impact (both in cache misses and lookup time to find freeable objects).
dirty_background_ratio is the percentage (of page cache memory that is dirty) when we start writing to disk in a non-blocking manner.
We made the following changes and observed the effects in memory, slabinfo, and cgroups.
vm.vfs_cache_pressure= 100 ==> 10000
vm.dirty_background_ratio= 10 ==> 5
A non invasive way to track the result was to periodically run a cron job that took a snapshot of the memory state. Something like:
#!/bin/bash
now=`date +%Y-%m-%d.%H:%M`
# create test dir
mkdir -p ~/memtest
# log meminfo
sudo cat /proc/meminfo > ~/memtest/meminfo_$now
# log slabinfo
sudo cat /proc/slabinfo > ~/memtest/slabinfo_$now
# log cgroups
sudo cat /proc/cgroups > ~/memtest/cgroups_$now
After applying the cache pressure changes and observing for a few hours we began the analysis. We concluded that we had gained about 8GB of free memory, but that memory had come directly from the page and disk caches, the Active(file) and Inactive(file) categories. This was a disappointing result, there was no significant net increase in available memory, plus we were no longer using this memory fruitfully. We had to recover memory from somewhere else.
After failing to increase Available memory directly we tried reducing competing categories. We noticed that the SUnreclaim memory category was large, in some cases ballooning to 60GB across a span of a few months. The SUnreclaim category tracks the memory used for object pools by the operating system that cannot be reclaimed under memory pressure. The first sign of an issue was a constantly growing number of cgroups. We expected at most a couple hundred cgroups from running our dockerized processes, but we were seeing cgroups in the HUNDREDS OF THOUSANDS. Fortunately for us, it seems that another engineer Roman Gushchin, from Facebook, had recently found and fixed this exact issue at the kernel level https://patchwork.kernel.org/cover/10943797/. He states:
The underlying problem is quite simple: any page charged to a cgroup holds a reference to it, so the cgroup can’t be reclaimed unless all charged pages are gone. If a slab object is actively used by other cgroups, it won’t be reclaimed, and will prevent the origin cgroup from being reclaimed.
This seemed to be our problem exactly, so we eagerly waited for kernel 5.3 to validate the fix.
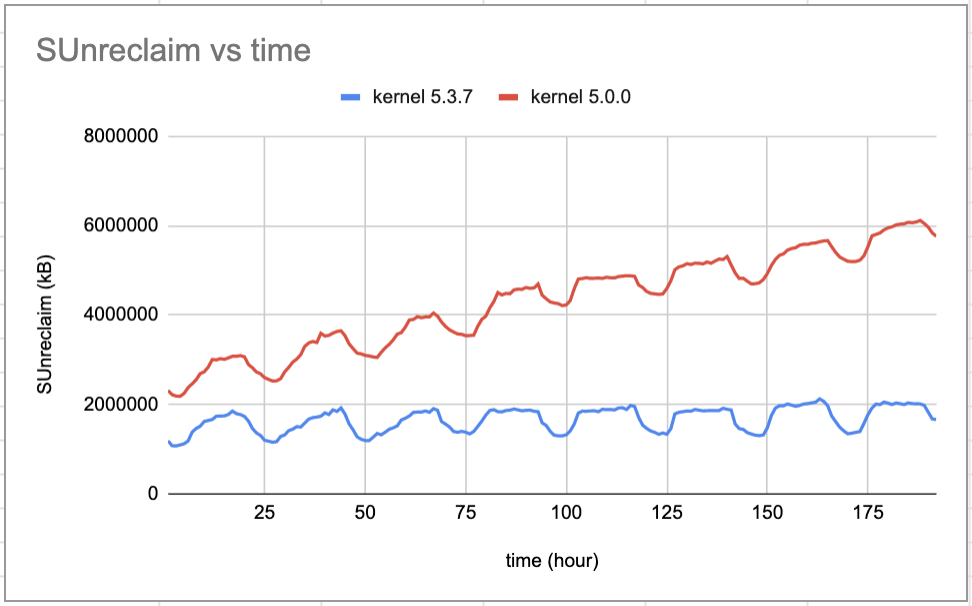
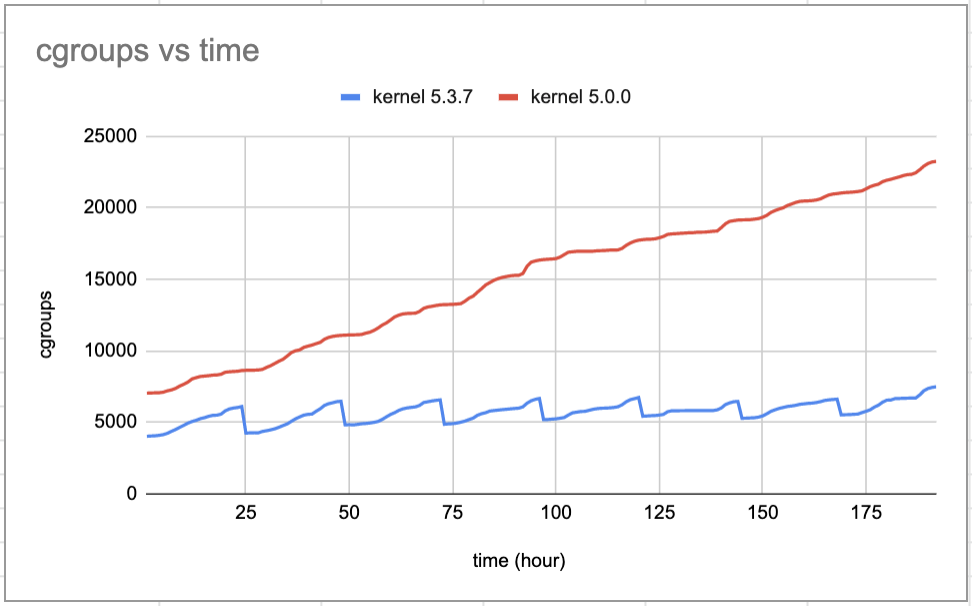
We re-used the memory tracking script from the cache pressure experiment, but for the kernel experiment we wanted to establish control and experimental groups. We unloaded production traffic from 2 racks of servers, then upgraded the kernel to 5.3 on one rack and kept kernel 5.0 on the other. Then we rebooted both racks and opened them up to production traffic again. After about a week we tracked how cgroups and unreclaimable slab memory changed over time. Here are the results:


Kernel 5.0.0 has uninterrupted growth of cgroups and in the span of a week gains 4GB of unreclaimable slab memory, for a total of 6GB. On the other hand, kernel 5.3.7 has significant daily reductions in cgroups, and the growth of unreclaimable slab memory is very slow. After a week, the unreclaimable slab memory is ~2 GB. With the new kernel, unreclaimable slab memory stabilizes at around 4 GB, even after several months of uptime.
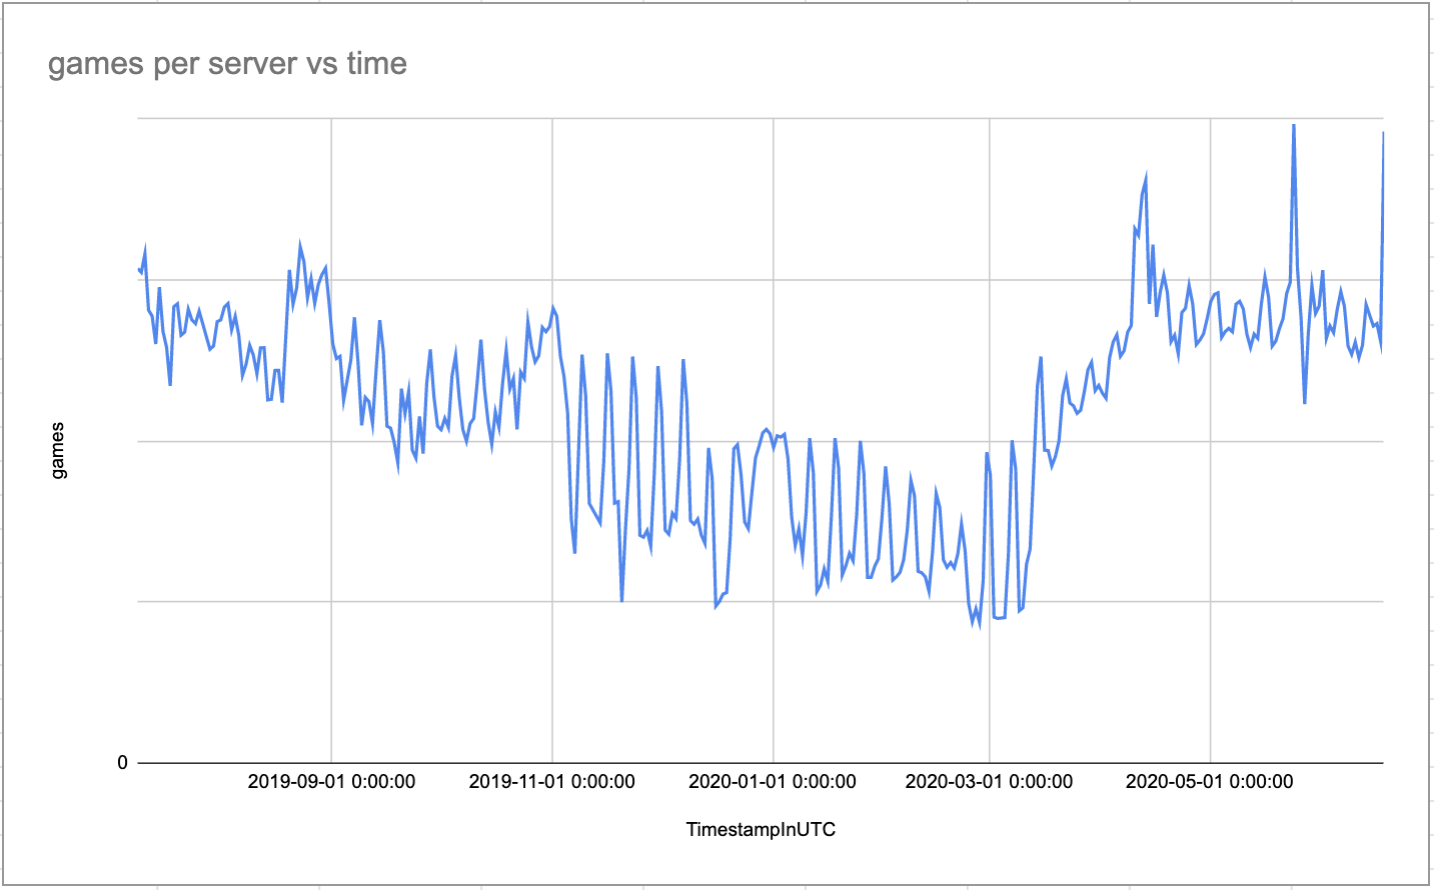
The ultimate problem we wanted to solve is that our game servers were losing capacity over time. This was due to less available memory, which was due to constantly growing unreclaimable slab memory. So once we got that relatively under control due to the kernel fix, what was the effect on server capacity?

On the left, you can see our issue, a steady decline of games per server that put a lot of strain on our infrastructure. We deployed kernel version 5.3 across our global fleet around March 2020, and we were able to maintain high server capacity so far. Much thanks to Roman Gushchin for the kernel fix and Andre Tran for helping with investigating the issue and deploying the fix.
Neither Roblox Corporation nor this blog endorses or supports any company or service. Also, no guarantees or promises are made regarding the accuracy, reliability or completeness of the information contained in this blog.
This blog post was originally published on the Roblox Tech Blog.