Today we are excited to announce a major overhaul of our Lua Debugger! This feature is designed to help you understand how your code is executing and identify bugs more effectively than commonly used options, such as print statements. If you have not recently explored the Lua Debugger, we invite you to investigate how it can be used to debug your code more effectively. Before describing the latest enhancements and fixes, let’s briefly review the key features of the Lua Debugger.
Breakpoints
Inserting Breakpoints into your code allows you to freeze the game at any point to inspect its logic. To use Breakpoints, track down approximately where your game is misbehaving and set Breakpoints on those statements where you need more information by clicking to the left of the line of code. Your code will temporarily stop executing and all global and local variables, properties, and object references will present the values they have been assigned in the game up to that point.
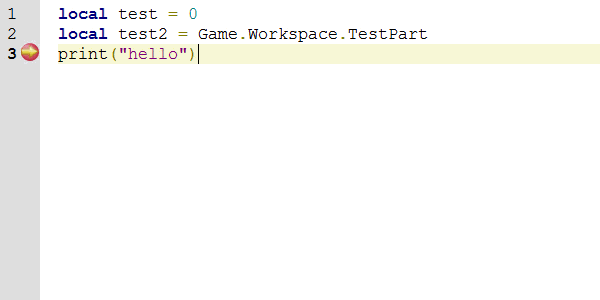
In this example, a breakpoint has been set at the print statement allowing you to inspect the value of set variables by hovering your cursor over them.
Step through your code
When you’ve paused your code at a specific Breakpoint, you can focus on diagnosing what’s happening. For example, when you reach other function calls you can Step Into those functions and investigate what they’re doing. You can also Step Out of any function, which will then run the code until the function returns and stops at the next statement in the code that called it. This functionality allows you to closely observe how variables are changing over time and which functions are being called.
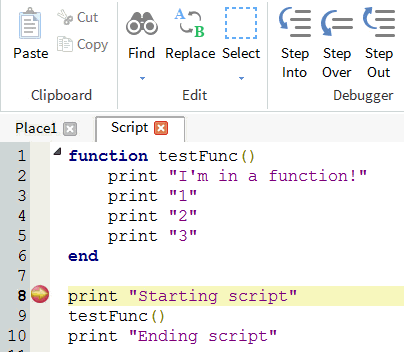
In this example, clicking the Step Into button moves the debugger inside the function called testFunc( )
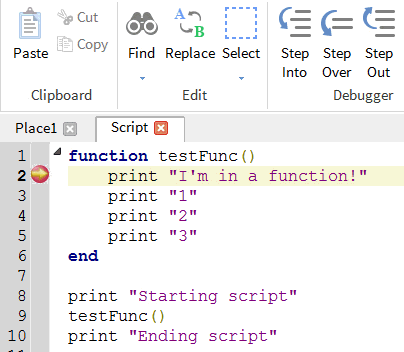
In this example, clicking the Step Out button moves the debugger out of the function called testFunc( ) and into the next line of code after the function was initially called.
Watch changes to your variables
Add Watch allows you to tell the Lua Debugger what variables you want to track or watch as they encounter Breakpoints. To add an item to the watch list, you simply highlight a variable and right-click on it in the script view and click the “Add Watch” menu item. Alternatively, you can click the Add Watch button and type in the name of the variable. This will automatically retrieve information about the value of the variable under watch when breakpoints are hit.
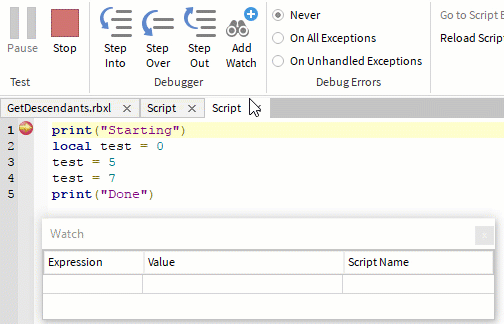
In this example, clicking on the “Add Watch” button displays a value as you Step Over each variable. You can also click the Add Watch button and type in the name of the variable. You can even add a watch directly by entering a variable in Watch window where the last empty row can be used to create new watches.
Call Stack
The Call Stack Window presents a list of functions that are called from each other in sequence. For example, function A calls function B, that in turn calls function C containing an embedded Breakpoint. Then, when the execution stops at that Breakpoint, the stack will show the order each function was called along with where the call was made. While watching local variables in function C, you can also switch between functions in the stack and change the context of the function currently selected in the stack list and examine changes to those local variables.
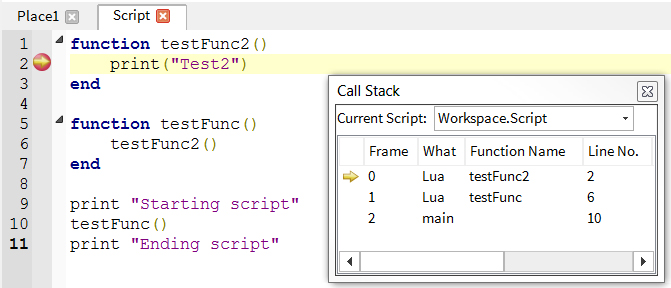
In this example, you can see where you are in your game when paused at a breakpoint in the code. If the current line of code was called from a function called from inside another function, the Call Stack will show the order the functions were called along with the line number where the call was made.
Using the Lua Debugger
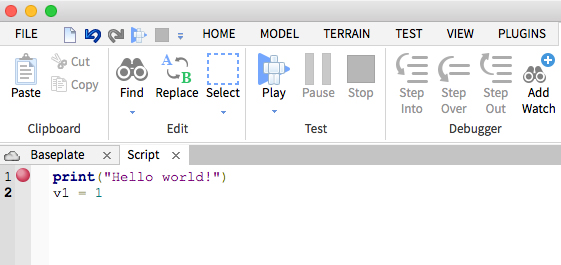
The Lua Debugger can be accessed whenever you are editing scripts in Roblox Studio. To get started and add Breakpoints into your code, simply click to the left of the line of code in the script window that you wish to pause. Each line you click on and designate as a Breakpoint will be indicated with a red dot.
As soon as you test play your game you can toggle the Breakpoint, Add Watch, and Call Stack options in the View menu and investigate the behavior of your code underneath the main viewport. It’s that simple! If you have not used the Lua Debugger before we encourage you to check it out.
New Enhancements
Now that we have reviewed the key features of the Lua Debugger, we have recently made a number of significant improvements and fixes, including:
- Fixed an issue where the correct script may not open on a Breakpoint or from the Call Stack window.
- Fixed Lua Debugger current line highlighting.
- Protected call or pcall errors are now properly detected.
- Added Mixed tables that allow you to watch and track values. You can also hover over a table variable and see all your values immediately with no need to print them out.
- Various minor UI enhancements.
- Various fixes to tooltips and the Add Watch window.
- Mouse Hover over single character variables now correctly shows the variable value.
- All properties are now listed in the tooltip and Watch window with no missing properties.
We are committed to providing the talented Roblox developer community with the tools they need. We would love to hear your feedback on how we can continue to enhance the Lua Debugger on the Developer Forum.