Blog Archive
 Over the last year, we’ve made ROBLOX look better and run more efficiently, released a new version of ROBLOX Studio, and even open-sourced code written by our team of pro game developers for your reference. This has all been in an effort to not only improve the player experience across platforms, but give developers the tools they need to develop high-quality games.
Ultimately, though, it’s up to you the developer to harness everything at your disposal, create content that transcends the competition, and engage players. There are many things that make up a high-quality game: good design, fun mechanics, responsive gameplay; the list goes on. But one thing that can take your game from amateur to professional is a consistent, bug-free player experience. To help you make the leap, we’ve launched a Lua debugger in ROBLOX Studio.
What is the Lua debugger?
The Lua debugger exists to help you better understand how your code is executing and identify bugs faster than other available options (e.g., lots of strategically placed print statements). It is an advanced Studio feature for developers who already have scripting knowledge and want to take their game code to the next level.
How does it work?
Before explaining the process of using the debugger, let’s do a quick debug vocabulary review.
- Breakpoint: an intentional stopping or pausing place in a program, put in place for debugging purposes
- Call Stack: a list of functions called from the beginning of a program until the execution of the current statement; mainly intended to keep track of the point to which each active subroutine should return control when it finishes executing
- Watch: A variable or expression evaluated in the context of the current stack frame; the values are updated with each step through the application and become visible every time the application is suspended

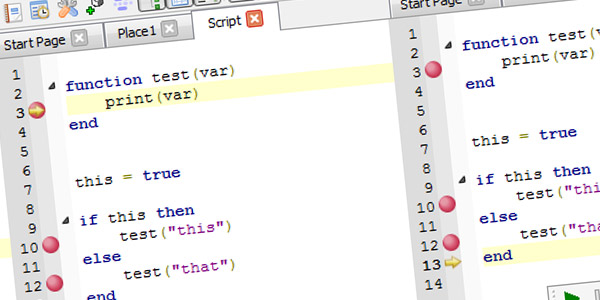
Notice the Breakpoints, Call Stack and Watch windows at the bottom of the screen.
Enabling the Lua debugger (we’ll get to that) allows you to toggle Breakpoint, Watch and Call Stack panels in ROBLOX Studio. You can also toggle them using three buttons (![]() ) in the Studio menu bar. These panels deliver information that help you understand and debug your scripts.
) in the Studio menu bar. These panels deliver information that help you understand and debug your scripts.
Before you can use them, you need to add breakpoints to your scripts. When viewing any of the scripts in your Workspace, simply click the number for any line of code. This will add a red dot, indicating a breakpoint. (Click it again to remove it.) You can also add a watch by right-clicking in the Watch panel and clicking New Watch. Enter an expression or variable, and you’ll see what value it returns at any given breakpoint. Watch expressions and variables are specific to a script (i.e. watch added for a script will be specific to that script only).
Once your breakpoints and watches are set, run a Play Solo (Test > Play Solo or F6) session of your game. Any time your game executes a line of code with a breakpoint, the game will stop and show the script and Breakpoint, Watch and Call Stack data. This means you can step through your code to see exactly what is happening to your variables and expressions, and find out exactly why a function was called. During execution of a script, you can pause the simulation (or debugging) to see how far your script has been executed.

Stepping through breakpoints in a script.
A few other points worth noting:
- Breakpoint and watches can also be added by right-clicking in your script editor window
- If there is an error in your script and it cannot compile, breakpoints won’t work
- If you modify or edit your script code during debugging, the debugging session must be restarted in order to recognize the modifications
After you’ve done your analysis, you can reset the breakpoint to run it again or resume the game until your hit the next breakpoint.
How do I enable the Lua debugger?
This feature is still in beta, so it’s only available by enabling it manually. Click Tools > Settings, then make sure the Studio tab is selected. Once selected, scroll all the way down to Beta Features and check the box for Lua Debugger.

We encourage advanced Studio users to give the Lua debugger a try and send us your feedback on the feature. One point worth noting is we’re planning to add Lua debugger functionality to the Start Server test mode so you can debug in an online setting. The Studio Team is active in the ROBLOX Studio forum and will be monitoring the comments of this article, so don’t hesitate to share your thoughts.
Happy debugging!